
The journey to becoming a Chartered Financial Analyst (CFA) is one of dedication, perseverance, and mastery over a broad range of financial concepts.
Among the most critical of these concepts are financial ratios.
These are simple, but powerful tools that allow analysts to decipher the complex language of financial statements.
Understanding these ratios deeply can help you cultivate the analytical acumen necessary to succeed in the financial services industry.
Why Financial Ratios Matter
The CFA curriculum is designed to build a solid foundation in financial analysis, and financial ratios are central to this.
These ratios distill vast amounts of data into actionable insights, making them indispensable for professionals who need to make informed decisions quickly.
They also help compare various companies within a geography or sector to establish key strengths and weaknesses between them
A Window into Corporate Health
Financial ratios provide a snapshot of a company’s health, revealing strengths and weaknesses that might not be immediately apparent from raw financial statements.
They help in assessing profitability, liquidity, efficiency, and solvency, allowing analysts to gauge whether a company is on solid ground or teetering on the edge of financial distress.
Doozy Digest
A newsletter for CFA candidates
Subscribe for:
✔ Insightful tips
✔ Expert advice
✔ Career motivation
✔ Exam inspiration
Stay updated and subscribe today!
The Language of Financial Statements
Ratios serve as the translator between the financial statements and the analyst’s insight.
They convert the raw numbers from balance sheets, income statements, and cash flow statements into meaningful metrics that can guide investment decisions, risk assessments, and valuations.
A Crucial Tool for CFA Candidates
For CFA candidates, mastering financial ratios is non-negotiable.
Not only do these ratios frequently appear in the exam’s multiple-choice questions and case studies, but they are also integral to the real-world scenarios that the CFA program aims to replicate.
Whether you’re calculating the return on equity (ROE) or analyzing the quick ratio, your ability to interpret these figures accurately will be tested.
Activity Ratios
Purpose
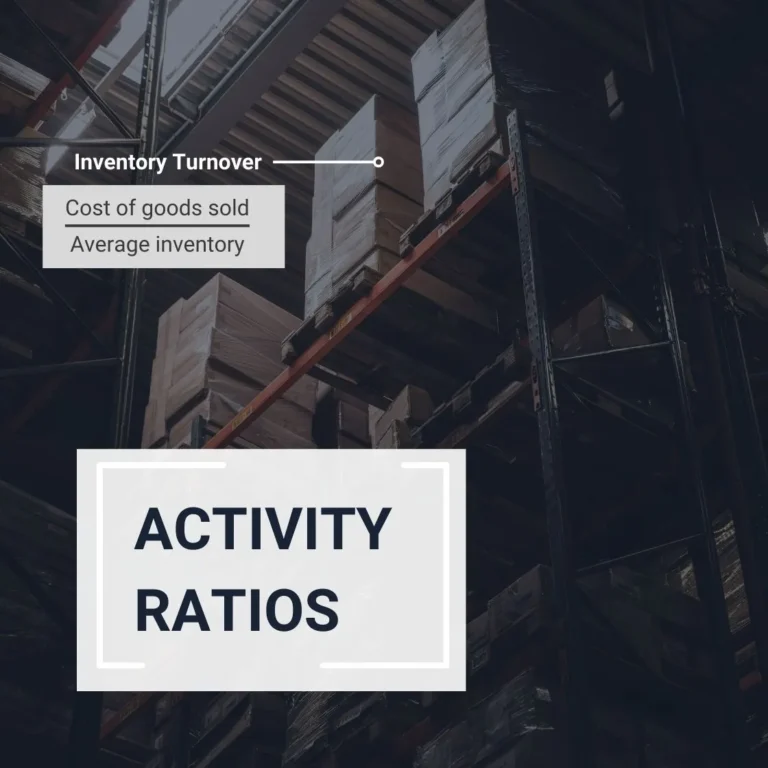
Activity ratios, also known as efficiency ratios, measure how effectively a company utilizes its assets to generate revenue and manage its day-to-day operations.
These ratios help analysts and investors assess a company’s operational efficiency by examining how quickly it converts resources – such as inventory, receivables, and payables – into cash flow.
By analyzing these metrics, businesses can identify areas for improvement, optimize working capital, and enhance overall financial performance.
| Activity Ratio | Formula | Purpose / What it Measures |
|---|---|---|
| Inventory Turnover | Cost of Goods Sold ÷ Average Inventory | Efficiency of managing inventory; indicates how quickly inventory is sold or used in a given period. |
| Days of Inventory on Hand (DOH) | Number of days in the period ÷ Inventory Turnover | Average time inventory remains in storage before being sold. |
| Receivables Turnover | Revenue or Revenue from Credit Sales ÷ Average Receivables | Effectiveness in collecting accounts receivable; indicates how quickly customers pay. |
| Days of Sales Outstanding (DSO) | Number of days ÷ Receivables Turnover | Average number of days it takes to collect receivables from customers. |
| Payables Turnover | Purchases ÷ Average Payables | Rate at which a company pays off its suppliers; indicates the frequency of settling trade payables. |
| Number of Days of Payables | Number of days in a period ÷ Payable Turnover | Average number of days it takes the company to pay its suppliers. |
| Working Capital Turnover | Revenue ÷ Average Working Capital | Efficiency in using working capital (current assets minus current liabilities) to generate sales revenue. |
| Fixed Assets Turnover | Revenue ÷ Average Fixed Assets | Efficiency in utilizing fixed assets (property, plant, equipment) to generate sales. |
| Total Assets Turnover | Revenue ÷ Average Total Assets | Effectiveness in using total assets to generate revenue; shows overall asset efficiency. |
Inventory Turnover
Inventory turnover is a key activity ratio that measures how efficiently a company manages its inventory by assessing how often it is sold and replaced within a given period. It is calculated using the formula:
This ratio is crucial for investors, creditors, and financial analysts as it provides insights into a company’s operational efficiency and sales performance. A higher inventory turnover typically indicates strong sales, efficient inventory management, and reduced holding costs, which is desirable in industries with perishable goods or fast-moving products. However, an excessively high turnover may signal inadequate inventory levels, potentially leading to stockouts and lost sales. Conversely, a low inventory turnover may suggest weak sales, overstocking, or obsolete inventory, raising concerns about liquidity and financial health. Analysts compare this ratio to industry benchmarks to assess whether a company is managing its inventory effectively, maintaining profitability, and avoiding unnecessary capital tied up in unsold goods.
Days of Inventory on Hand
Days of Inventory on Hand (DOH) is an activity ratio that measures how many days, on average, a company takes to sell its entire inventory.
It is a key indicator of inventory management efficiency and is calculated using the formula:
Days of Inventory on Hand (DOH) = (Number of Days in Period) ÷ (Inventory Turnover)
This ratio helps investors, creditors, and financial analysts understand how efficiently a company converts inventory into sales.
A lower DOH indicates that a company is selling inventory quickly, which can be a positive sign of strong demand and efficient inventory management.
However, if DOH is too low, it may suggest the company is understocked and could risk losing sales due to insufficient inventory.
Conversely, a higher DOH suggests that inventory is sitting unsold for a longer time, which could indicate weak demand, overstocking, or potential obsolescence.
Analysts compare DOH across companies in the same industry to assess operational efficiency, cash flow management, and potential liquidity risks.
Receivables Turnover
Receivables Turnover is an activity ratio that measures how efficiently a company collects payments from its customers over a given period.
It indicates how many times, on average, a company converts its accounts receivable into cash during the period.
The formula for calculating receivables turnover is:
Receivables Turnover = Revenue (or Credit Sales) ÷ Average Receivables
This ratio is essential for investors, creditors, and financial analysts because it provides insights into a company’s cash flow management and credit policies.
A higher receivables turnover suggests that the company collects payments quickly, which improves liquidity and reduces the risk of bad debts.
It may also indicate strict credit policies or a strong customer base with timely payments.
Conversely, a lower receivables turnover may signal inefficient collection processes, lenient credit policies, or financial difficulties among customers.
Analysts compare this ratio across industry peers to evaluate a company’s ability to manage credit sales effectively and maintain strong cash flow.
Days of Sales Outstanding
Days of Sales Outstanding (DSO) is an activity ratio that measures the average number of days a company takes to collect payment after making a sale.
It helps assess how efficiently a company manages its accounts receivable and is calculated using the formula:
Days of Sales Outstanding (DSO) = (Number of Days in Period) ÷ (Receivables Turnover)
This ratio is crucial for investors, creditors, and financial analysts as it provides insights into a company’s cash flow cycle and credit management practices.
A lower DSO indicates that the company collects payments quickly, which improves liquidity and reduces credit risk.
This can be a sign of strong credit policies or high-quality customers who pay on time.
A higher DSO, on the other hand, suggests that customers take longer to pay, which could indicate weak collection processes, lenient credit terms, or financial strain among clients.
Analysts compare DSO across industry peers to evaluate how efficiently a company converts credit sales into cash and whether its credit policies are aligned with best practices.
Payables Turnover
Payables Turnover is an activity ratio that measures how efficiently a company pays its suppliers by assessing how many times, on average, it settles its accounts payable within a given period.
The formula for calculating payables turnover is:
Payables Turnover = Purchases ÷ Average Payables
This ratio is important for investors, creditors, and financial analysts as it provides insights into a company’s liquidity, cash flow management, and relationships with suppliers.
A higher payables turnover indicates that the company is paying its suppliers quickly, which may suggest strong liquidity or favorable supplier agreements.
However, if the ratio is too high, it could also indicate that the company is not taking full advantage of credit terms offered by suppliers.
A lower payables turnover suggests that the company is taking longer to pay its obligations, which could indicate cash flow constraints or strategic use of supplier credit.
Comparing this ratio to industry benchmarks helps assess whether a company is managing its short-term liabilities efficiently while maintaining good supplier relationships.
Number of Days of Payables
Number of Days of Payables is an activity ratio that measures the average number of days a company takes to pay its suppliers after receiving goods or services. It provides insight into a company’s cash flow management and supplier payment practices.
The formula for calculating the number of days of payables is:
Number of Days of Payables = (Number of Days in Period) ÷ (Payables Turnover)
This ratio is particularly useful for investors, creditors, and financial analysts as it highlights how a company balances its cash outflows and credit terms.
A higher number of days of payables suggests that the company is delaying payments, which may indicate cash flow optimization or potential liquidity issues.
While delaying payments can improve short-term liquidity, excessive delays could strain supplier relationships or indicate financial distress.
Conversely, a lower number of days of payables suggests that the company pays its suppliers quickly, which may reflect strong liquidity or a lack of negotiation on favorable credit terms.
Comparing this ratio to industry benchmarks helps assess whether a company is efficiently managing its working capital while maintaining good supplier relations.
Working Capital Turnover
Working Capital Turnover is an activity ratio that measures how efficiently a company utilizes its working capital to generate revenue.
It indicates how effectively a company is using its short-term assets and liabilities to support sales growth.
The formula for calculating working capital turnover is:
Working Capital Turnover = Revenue ÷ Average Working Capital
where Working Capital = Current Assets – Current Liabilities.
This ratio is important for investors, creditors, and financial analysts as it provides insight into a company’s operational efficiency and short-term financial health.
A higher working capital turnover suggests that the company is efficiently using its available resources to generate sales, which can indicate strong management and financial discipline.
However, if the ratio is excessively high, it may signal that the company has insufficient working capital to sustain growth.
A lower working capital turnover may indicate poor utilization of assets, excessive current assets, or liquidity issues.
Analysts compare this ratio across industries and historical trends to determine how effectively a company is managing its working capital to drive revenue and growth.
Fixed Assets Turnover
Fixed Assets Turnover is an activity ratio that measures how efficiently a company utilizes its fixed assets, such as property, plant, and equipment (PP&E), to generate revenue.
It helps assess how well a company is leveraging its long-term investments in productive assets.
The formula for calculating fixed assets turnover is:
Fixed Assets Turnover = Revenue ÷ Average Fixed Assets
This ratio is valuable for investors, creditors, and financial analysts as it provides insight into asset efficiency and capital productivity.
A higher fixed assets turnover suggests that the company is effectively using its fixed assets to drive revenue, which can indicate strong asset management and operational efficiency.
However, an excessively high ratio may suggest underinvestment in infrastructure, potentially limiting future growth.
Conversely, a lower fixed assets turnover could indicate inefficient use of assets, excessive capital investment, or underutilization of production capacity.
Analysts compare this ratio to industry benchmarks to assess whether a company is managing its fixed assets optimally and generating sufficient returns on capital-intensive investments.
Total Assets Turnover
Total Assets Turnover is an activity ratio that measures how efficiently a company utilizes its total assets to generate revenue.
It provides insight into how well management is using both fixed and current assets to drive sales.
The formula for calculating total assets turnover is:
Total Assets Turnover = Revenue ÷ Average Total Assets
This ratio is essential for investors, creditors, and financial analysts as it indicates a company’s overall asset efficiency.
A higher total assets turnover suggests that the company is effectively using its resources to generate revenue, which can be a sign of strong operational management.
However, an excessively high ratio may indicate that the company lacks sufficient assets to support future growth.
A lower total assets turnover may signal inefficient asset utilization, excess investment in underperforming assets, or declining sales performance.
Analysts compare this ratio to industry standards to evaluate whether a company is generating an optimal return on its asset base and efficiently managing its resources.
Liquidity Ratios
Purpose
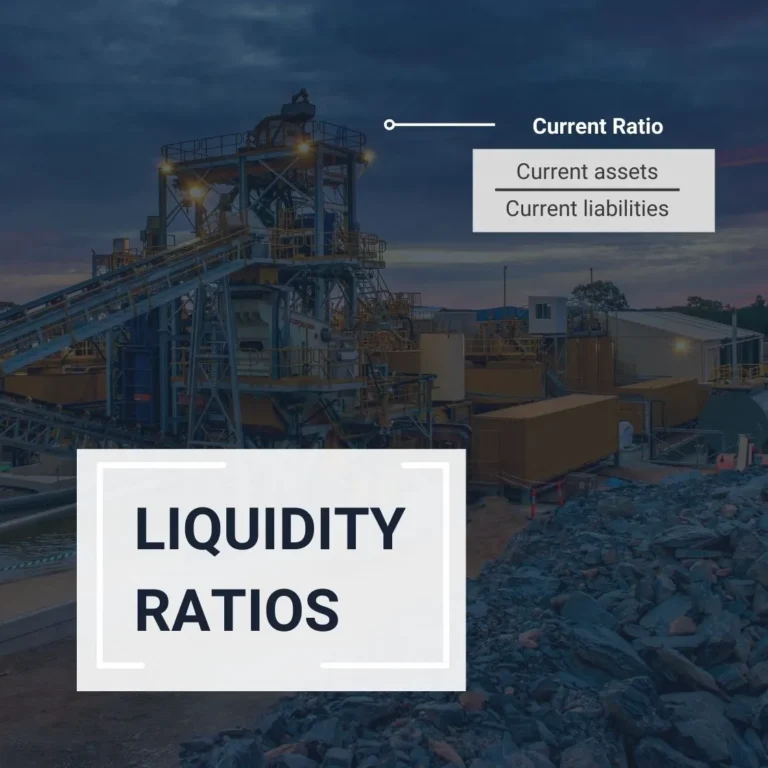
Liquidity ratios assess a company’s ability to meet its short-term obligations using its current assets.
These ratios provide insight into a firm’s financial health by measuring how easily it can convert assets into cash to cover liabilities.
A higher liquidity ratio generally indicates a stronger financial position, reducing the risk of default.
Liquidity ratios are essential for investors, creditors, and financial analysts in evaluating a company’s ability to withstand financial stress, manage cash flow effectively, and sustain operations during economic downturns.
Liquidity Ratios
| Liquidity Ratio | Formula | Purpose / What it Measures |
|---|---|---|
| Current Ratio | Current Assets ÷ Current Liabilities | Company's ability to meet short-term obligations with current assets; measures short-term solvency. |
| Quick Ratio | (Cash + Short-term Marketable Securities + Receivables) ÷ Current Liabilities | Ability to meet immediate obligations without relying on inventory; indicates liquidity position. |
| Cash Ratio | (Cash + Short-term Marketable Securities) ÷ Current Liabilities | Company's capacity to repay short-term liabilities solely from cash and cash equivalents. |
| Defensive Interval | (Cash + Short-term Marketable Securities + Receivables) ÷ Daily Expenditures | Duration (in days) the company can operate using liquid assets without additional cash inflow. |
| Cash Conversion Cycle | DOH + DSO – Number of Days of Payables | Time (in days) required to convert investments in inventory and other resources into cash flows. |
Current Ratio
The Current Ratio is a liquidity ratio that measures a company’s ability to meet its short-term obligations using its current assets.
It indicates how well a company can cover its short-term liabilities with assets that are expected to be converted into cash within a year.
The formula for calculating the current ratio is:
Current Ratio = Current Assets ÷ Current Liabilities
This ratio is crucial for investors, creditors, and financial analysts as it provides insight into a company’s short-term financial health and liquidity position.
A higher current ratio suggests that a company has a strong liquidity position and is well-equipped to cover its short-term obligations, which can be reassuring to lenders and suppliers.
However, an excessively high ratio may indicate inefficient use of assets or excessive cash reserves.
A lower current ratio could signal potential liquidity issues, meaning the company may struggle to meet short-term debts, which could be a red flag for creditors.
Analysts compare this ratio across industry benchmarks to assess whether a company is maintaining an optimal balance between liquidity and operational efficiency.
Quick Ratio
The Quick Ratio, also known as the Acid-Test Ratio, is a liquidity ratio that measures a company’s ability to meet its short-term liabilities using its most liquid assets.
Unlike the Current Ratio, it excludes inventory and other less liquid assets, focusing only on assets that can be quickly converted into cash.
The formula for calculating the quick ratio is:
Quick Ratio = (Cash + Short-term Marketable Securities + Receivables) ÷ Current Liabilities
This ratio is essential for investors, creditors, and financial analysts as it provides a more conservative view of a company’s liquidity position.
A higher quick ratio indicates that a company has sufficient liquid assets to cover its short-term liabilities, which is a positive sign of financial stability.
However, an excessively high ratio may suggest that the company is not utilizing its assets efficiently.
A lower quick ratio could indicate potential liquidity risks, meaning the company may struggle to meet short-term obligations without selling inventory or securing additional financing.
Analysts compare this ratio to industry benchmarks to determine whether a company is maintaining a healthy liquidity balance while efficiently managing its resources.
Cash Ratio
The Cash Ratio is the most conservative liquidity ratio that measures a company’s ability to meet its short-term liabilities using only its most liquid assets – cash and short-term marketable securities.
Unlike the Current Ratio and Quick Ratio, it excludes receivables and inventory, focusing solely on assets that are immediately available for debt repayment.
The formula for calculating the cash ratio is:
Cash Ratio = (Cash + Short-term Marketable Securities) ÷ Current Liabilities
This ratio is particularly important for investors, creditors, and financial analysts as it provides the strictest measure of a company’s short-term financial health.
A higher cash ratio suggests that the company has ample liquidity to cover its obligations without relying on asset sales or future cash inflows, which is reassuring in times of financial uncertainty.
However, an excessively high cash ratio may indicate inefficient capital allocation, as excessive cash holdings could be better utilized in growth or investment opportunities.
A lower cash ratio suggests that the company relies more on receivables and inventory to meet short-term obligations, which could signal liquidity risk if cash flow slows down.
Analysts compare this ratio across industries to determine if a company is maintaining an optimal liquidity balance while effectively deploying its cash reserves.
Defensive Interval
The Defensive Interval Ratio (DIR) is a liquidity ratio that measures how many days a company can continue to operate using only its most liquid assets, without needing additional cash inflows.
It provides insight into how long a company can sustain its operations using readily available resources.
The formula for calculating the defensive interval is:
Defensive Interval = (Cash + Short-term Marketable Securities + Receivables) ÷ Daily Expenditures
This ratio is particularly valuable for investors, creditors, and financial analysts as it helps assess a company’s ability to withstand periods of financial stress or revenue disruptions.
A higher defensive interval suggests that a company has a strong liquidity position and can continue covering operating expenses for an extended period without requiring additional financing.
This is especially important in industries with cyclical revenue patterns or economic downturn risks.
Conversely, a lower defensive interval indicates that the company may face liquidity challenges if cash inflows slow down, making it more reliant on short-term financing or asset sales.
Analysts use this ratio to evaluate a company’s financial resilience and its ability to manage working capital efficiently.
Cash Conversion Cycle
The Cash Conversion Cycle (CCC) is an activity ratio that measures the time it takes for a company to convert its investments in inventory and other resources into cash flows from sales.
It reflects the efficiency of a company’s working capital management by analyzing how quickly it buys inventory, sells products, and collects cash from customers.
The formula for calculating the cash conversion cycle is:
Cash Conversion Cycle = Days of Inventory on Hand (DOH) + Days of Sales Outstanding (DSO) – Number of Days of Payables
This ratio is crucial for investors, creditors, and financial analysts as it provides insight into a company’s ability to manage cash flow effectively.
A shorter CCC indicates that the company is efficiently turning inventory into cash, which can lead to better liquidity and reduced reliance on external financing.
A longer CCC may suggest inefficiencies in inventory management, slow receivables collection, or extended payment terms with suppliers, potentially leading to cash flow constraints.
Analysts compare this ratio across industry peers to assess how well a company is optimizing its working capital and whether it has a competitive advantage in managing its cash conversion process.
Solvency Ratios
Purpose
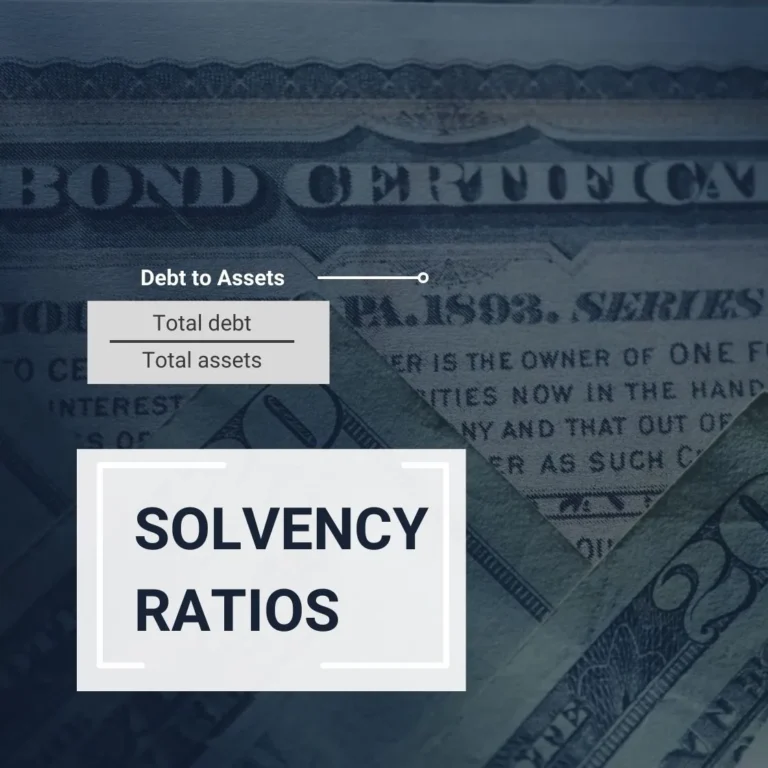
Solvency ratios evaluate a company’s long-term financial stability by assessing its ability to meet debt obligations and sustain operations over time.
Unlike liquidity ratios, which focus on short-term financial health, solvency ratios provide a broader view of a firm’s capital structure and overall financial resilience.
These ratios are crucial for investors, creditors, and financial analysts as they help determine whether a company is overleveraged or maintaining a sustainable balance between debt and equity.
A strong solvency position signals financial strength, reducing the risk of default and enhancing investor confidence, while a weak solvency position may indicate financial distress or an over-reliance on borrowing.
Additionally, coverage ratios (often grouped within solvency analysis) gauge a firm’s ability to service its debt and fixed financial obligations using its earnings or cash flow.
These insights are essential for lenders in assessing credit risk, for investors in evaluating long-term profitability and stability, and for financial analysts in benchmarking industry performance.
Solvency Ratios
| Solvency Ratio | Formula | Purpose / What it Measures |
|---|---|---|
| Debt-to-Assets | Total Debt ÷ Total Assets | Proportion of assets financed by debt; measures company's overall leverage. |
| Debt-to-Capital | Total Debt ÷ (Total Debt + Total Shareholders' Equity) | Portion of capital structure funded by debt; indicates financial structure and solvency risk. |
| Debt-to-Equity | Total Debt ÷ Total Shareholders' Equity | Relationship between debt financing and equity financing; assesses financial leverage and risk. |
| Financial Leverage | Average Total Assets ÷ Total Shareholders' Equity | Degree to which a company uses equity capital to finance its assets; higher leverage implies higher risk. |
Debt-to-Assets
The Debt-to-Assets Ratio is a solvency ratio that measures the proportion of a company’s assets that are financed by debt.
It helps assess financial risk by showing how much of a company’s total assets are funded through borrowing rather than equity.
The formula for calculating the debt-to-assets ratio is:
Debt-to-Assets = Total Debt ÷ Total Assets
This ratio is essential for investors, creditors, and financial analysts as it provides insight into a company’s financial leverage and long-term stability.
A higher debt-to-assets ratio indicates that a significant portion of the company’s assets is financed through debt, which may increase financial risk, particularly during economic downturns.
However, moderate levels of debt can be beneficial if they are used to finance growth and generate higher returns.
A lower debt-to-assets ratio suggests that a company relies more on equity financing, reducing financial risk but potentially limiting growth opportunities.
Analysts compare this ratio across industry benchmarks to evaluate whether a company has a sustainable capital structure and can meet its long-term obligations.
Debt-to-Capital
The Debt-to-Capital Ratio is a solvency ratio that measures the proportion of a company’s total capital that comes from debt financing.
It provides insight into a company’s financial structure and risk exposure by comparing debt to the total capital available.
The formula for calculating the debt-to-capital ratio is:
Debt-to-Capital = Total Debt ÷ (Total Debt + Total Shareholders’ Equity)
This ratio is crucial for investors, creditors, and financial analysts as it indicates how much financial leverage a company is using.
A higher debt-to-capital ratio suggests that the company is more reliant on debt financing, which may increase financial risk, especially if interest rates rise or earnings decline.
However, in industries where debt is used strategically to fuel growth, a higher ratio may not necessarily be negative.
A lower debt-to-capital ratio indicates a stronger reliance on equity financing, which may reduce financial risk but could also limit potential returns to shareholders.
Analysts use this ratio to assess a company’s financial stability, compare it with industry norms, and determine whether its capital structure aligns with its growth strategy and risk tolerance.
Debt-to-Equity
The Debt-to-Equity Ratio is a solvency ratio that measures the proportion of a company’s financing that comes from debt versus equity.
It indicates how leveraged a company is and the level of financial risk associated with its capital structure.
The formula for calculating the debt-to-equity ratio is:
Debt-to-Equity = Total Debt ÷ Total Shareholders’ Equity
This ratio is essential for investors, creditors, and financial analysts as it provides insight into a company’s financial stability and risk exposure.
A higher debt-to-equity ratio suggests that the company relies more on debt financing, which may amplify returns to shareholders during periods of growth but also increases financial risk and interest obligations.
If the ratio is too high, it may signal potential solvency issues, particularly if earnings decline.
A lower debt-to-equity ratio indicates a stronger reliance on equity financing, reducing financial risk but potentially limiting growth opportunities.
Analysts compare this ratio across industries to evaluate whether a company’s capital structure is sustainable and aligned with its financial strategy.
Financial Leverage
The Financial Leverage Ratio is a solvency ratio that measures the degree to which a company uses debt to finance its assets.
It indicates how dependent a company is on borrowed capital and provides insight into financial risk and potential return on equity.
The formula for calculating financial leverage is:
Financial Leverage = Average Total Assets ÷ Average Total Shareholders’ Equity
This ratio is important for investors, creditors, and financial analysts as it reflects a company’s capital structure and risk exposure.
A higher financial leverage ratio suggests that a company is using more debt to finance its assets, which can amplify returns for shareholders but also increases financial risk, particularly if earnings decline or interest rates rise.
A lower financial leverage ratio indicates a stronger reliance on equity financing, reducing financial risk but potentially limiting the ability to scale operations quickly.
Analysts compare this ratio to industry benchmarks to assess whether a company’s leverage level is appropriate for its business model and growth strategy.
| Coverage Ratio | Formula | Purpose / What it Measures |
|---|---|---|
| Interest Coverage | EBIT ÷ Interest Payments | Company's ability to meet interest payments from its operating earnings (EBIT); measures risk of default. |
| Fixed Charge Coverage | (EBIT + Lease Payments) ÷ (Interest Payments + Lease Payments) | Ability to meet fixed financial obligations (interest and leases) from earnings; broader measure of solvency and liquidity risk. |
Interest Coverage
The Interest Coverage Ratio is a coverage ratio that measures a company’s ability to meet its interest obligations using its operating earnings.
It helps assess financial stability and the risk of default by determining how many times a company can cover its interest expenses with its earnings before interest and taxes (EBIT).
The formula for calculating the interest coverage ratio is:
Interest Coverage = EBIT ÷ Interest Payments
This ratio is crucial for investors, creditors, and financial analysts as it provides insight into a company’s financial health and ability to service debt.
A higher interest coverage ratio indicates that a company generates sufficient earnings to cover its interest expenses, reducing default risk and making it more attractive to lenders and bondholders.
Conversely, a lower interest coverage ratio suggests that the company may struggle to meet its interest obligations, raising concerns about financial distress and solvency.
If the ratio falls below 1, it means the company is not generating enough earnings to cover interest payments, which could lead to liquidity issues or restructuring.
Analysts use this ratio to compare companies within an industry and assess their financial resilience under different economic conditions.
Fixed Charge Coverage
The Fixed Charge Coverage Ratio is a coverage ratio that measures a company’s ability to meet its fixed financial obligations, including interest payments and lease expenses, using its operating earnings.
This ratio provides a broader assessment of financial stability than the Interest Coverage Ratio, as it includes additional fixed costs beyond just interest.
The formula for calculating the fixed charge coverage ratio is:
Fixed Charge Coverage = (EBIT + Lease Payments) ÷ (Interest Payments + Lease Payments)
This ratio is essential for investors, creditors, and financial analysts as it helps determine whether a company generates enough earnings to cover its fixed expenses.
A higher fixed charge coverage ratio indicates that the company has strong earnings relative to its fixed obligations, suggesting lower financial risk and greater ability to manage debt and leases.
A lower ratio, on the other hand, may signal that the company is overleveraged or struggling to generate enough earnings to cover its fixed costs, raising concerns about liquidity and financial distress.
Analysts use this ratio to compare companies within capital-intensive industries and assess their ability to withstand economic downturns while meeting long-term commitments.
Profitability Ratios
Purpose
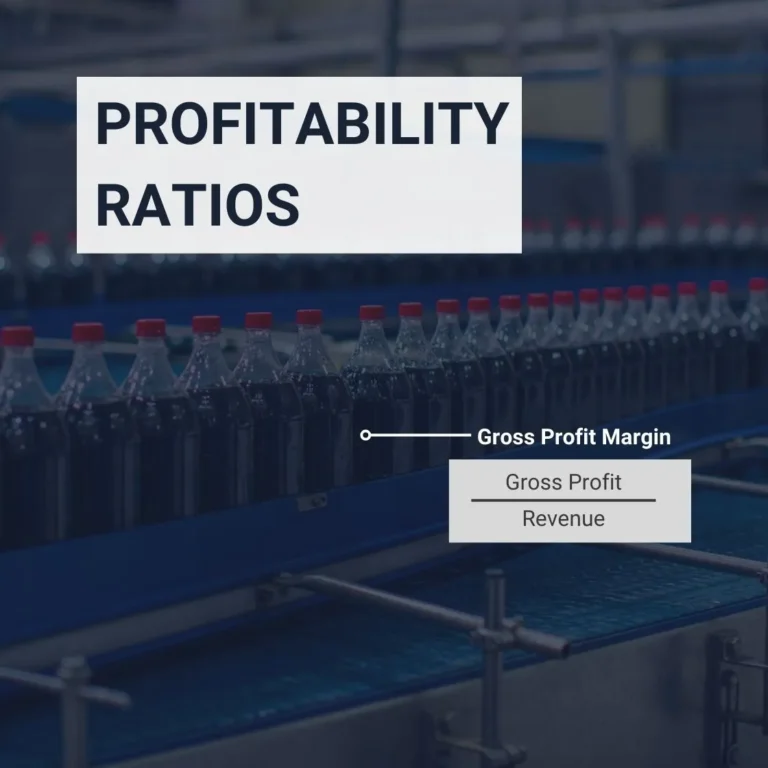
Profitability ratios measure a company’s ability to generate earnings relative to its revenue, assets, and equity, providing a comprehensive view of financial performance.
These ratios help investors, creditors, and financial analysts assess how efficiently a company converts sales into profits and how effectively it utilizes its resources to create value.
A strong profitability profile indicates a well-managed business with healthy margins, competitive pricing power, and effective cost control, making it attractive to investors seeking growth and dividends.
For creditors, profitability ratios are essential in evaluating a company’s capacity to generate sufficient earnings to meet financial obligations, reducing the risk of default.
Financial analysts use these ratios to compare companies within the same industry, identify trends in performance, and determine long-term sustainability.
Ultimately, profitability ratios serve as a key indicator of financial strength, helping stakeholders make informed decisions about investment, lending, and strategic planning.
| Return on Sales Ratio | Formula | Purpose / What it Measures |
|---|---|---|
| Gross Profit Margin | Gross Profit ÷ Revenue | Percentage of revenue remaining after deducting cost of goods sold; indicates production efficiency and pricing strategy. |
| Operating Margin | Operating Profit ÷ Revenue | Profitability from core operations, excluding interest and taxes; measures operational efficiency and management effectiveness. |
| Pretax Margin | Earnings Before Taxes (EBT) ÷ Revenue | Profit generated from sales before tax obligations; reflects overall operational and financial efficiency before taxes. |
| Net Profit Margin | Net Income ÷ Revenue | Proportion of revenue remaining as profit after all expenses, taxes, and costs; measures overall profitability. |
Gross Profit Margin
The Gross Profit Margin is a profitability ratio that measures how efficiently a company generates profit from its revenue after accounting for the direct costs of goods sold (COGS).
It indicates the percentage of revenue that remains after covering production costs, providing insight into a company’s pricing strategy, cost control, and overall financial health.
The formula for calculating gross profit margin is:
Gross Profit Margin = (Revenue – Cost of Goods Sold) ÷ Revenue
This ratio is crucial for investors, creditors, and financial analysts as it helps assess a company’s core profitability before considering other operating expenses.
A higher gross profit margin suggests that the company is effectively managing production costs and maintaining strong pricing power, which can lead to greater profitability and financial stability.
Conversely, a lower gross profit margin may indicate rising production costs, inefficiencies, or pricing pressures that could impact overall earnings.
Analysts compare this ratio across industry peers to evaluate a company’s competitive position and ability to generate sustainable profits.
Operating Margin
The Operating Margin is a profitability ratio that measures a company’s ability to generate profit from its core operations before considering interest and taxes.
It reflects how efficiently a company controls its operating expenses relative to its revenue.
The formula for calculating operating margin is:
Operating Margin = Operating Income (EBIT) ÷ Revenue
This ratio is essential for investors, creditors, and financial analysts as it provides insight into a company’s operational efficiency and cost management.
A higher operating margin indicates that a company is effectively controlling costs and generating strong profits from its operations, which can lead to higher financial stability and growth potential.
A lower operating margin, on the other hand, may suggest rising costs, pricing pressures, or inefficiencies that could impact profitability.
Analysts compare this ratio across industry peers to determine how well a company is managing its operating expenses and whether it has a competitive advantage in generating earnings from its core business activities.
Pretax Margin
The Pretax Margin is a profitability ratio that measures a company’s ability to generate earnings before accounting for income taxes.
It reflects how efficiently a company converts revenue into profit before tax expenses are deducted.
The formula for calculating pretax margin is:
Pretax Margin = Earnings Before Taxes (EBT) ÷ Revenue
This ratio is important for investors, creditors, and financial analysts as it provides a clearer picture of a company’s profitability before the impact of taxation, which can vary across industries and jurisdictions.
A higher pretax margin indicates strong profitability from operations and financial management, suggesting that the company is generating healthy earnings before tax expenses.
A lower pretax margin may signal high operating costs, inefficient financial management, or increased non-operating expenses that reduce profitability.
Analysts use this ratio to compare companies within an industry, assess cost efficiency, and evaluate a company’s ability to maintain profitability regardless of tax policies.
Net Profit Margin
The Net Profit Margin is a profitability ratio that measures the percentage of revenue that remains as net income after all expenses, including operating costs, interest, taxes, and other deductions, have been accounted for.
It provides a comprehensive view of a company’s overall profitability.
The formula for calculating net profit margin is:
Net Profit Margin = Net Income ÷ Revenue
This ratio is essential for investors, creditors, and financial analysts as it indicates how efficiently a company converts revenue into actual profit.
A higher net profit margin suggests strong cost control, efficient operations, and effective financial management, making the company more attractive to investors.
Conversely, a lower net profit margin may indicate rising costs, pricing challenges, or inefficiencies that reduce overall profitability.
Analysts compare this ratio across industry benchmarks to assess a company’s financial health, competitive positioning, and ability to sustain long-term profitability.
| Return on Investment Ratio | Formula | Purpose / What it Measures |
|---|---|---|
| Operating ROA | Operating Income ÷ Average Total Assets | Efficiency in using total assets to generate operating profit; measures asset profitability excluding financing effects. |
| ROA | Net Income ÷ Average Total Assets | Effectiveness in utilizing assets to generate net profit; overall measure of asset efficiency. |
| Return on Total Capital | EBIT ÷ (Debt + Equity) | Company’s effectiveness in generating returns from the total capital invested (both debt and equity). |
| ROE | Net Income ÷ Average Total Equity | Ability to generate profits from shareholders' equity; indicates how effectively equity is utilized. |
| Return on Common Equity | (Net Income – Preferred Dividends) ÷ Average Common Equity | Profitability measure specifically for common shareholders; measures returns on common equity investments. |
Operating ROA
The Operating Return on Assets (Operating ROA) is a profitability ratio that measures how efficiently a company uses its total assets to generate operating income.
Unlike traditional Return on Assets (ROA), which considers net income, Operating ROA focuses on operating income (EBIT), providing a clearer view of how well a company’s core operations generate returns from its asset base.
The formula for calculating Operating ROA is:
Operating ROA = Operating Income (EBIT) ÷ Average Total Assets
This ratio is crucial for investors, creditors, and financial analysts as it helps evaluate a company’s operational efficiency and asset utilization.
A higher Operating ROA indicates that the company effectively generates profits from its assets before considering financing and tax effects, signaling strong operational performance.
Conversely, a lower Operating ROA may suggest that the company is not using its assets efficiently or has high operating costs that reduce profitability.
Analysts compare this ratio across industries to assess how well a company manages its asset base to drive core business profits.
Return on Assets (ROA)
The Return on Assets (ROA) is a profitability ratio that measures how efficiently a company utilizes its total assets to generate net income.
It provides insight into a company’s ability to convert its investments in assets into earnings.
The formula for calculating ROA is:
ROA = Net Income ÷ Average Total Assets
This ratio is crucial for investors, creditors, and financial analysts as it helps assess a company’s operational efficiency and overall profitability.
A higher ROA indicates that the company is effectively using its assets to generate profit, which can be a sign of strong management and financial health.
Conversely, a lower ROA may suggest inefficiencies in asset utilization, high operational costs, or low profitability.
Analysts compare this ratio across industry benchmarks to determine how well a company is managing its resources to drive financial performance.
Return on Total Capital (ROTC)
The Return on Total Capital (ROTC) is a profitability ratio that measures how efficiently a company generates earnings from the total capital invested in its business.
This includes both debt and equity, providing insight into how well the company is using its financial resources to generate returns.
The formula for calculating ROTC is:
Return on Total Capital = EBIT ÷ (Total Debt + Total Shareholders’ Equity)
This ratio is important for investors, creditors, and financial analysts as it evaluates a company’s ability to generate profits relative to the capital it has raised.
A higher ROTC indicates that the company is efficiently utilizing both borrowed and owned capital to produce earnings, making it attractive to both investors and lenders.
Conversely, a lower ROTC may suggest inefficient capital use, excessive debt, or weak operational performance.
Analysts compare this ratio to industry standards to assess whether a company is generating sufficient returns on its total funding sources while managing financial risk effectively.
Return on Equity (ROE)
The Return on Equity (ROE) is a profitability ratio that measures how effectively a company generates profit from its shareholders’ equity.
It indicates how well a company is using investors’ funds to create value.
The formula for calculating ROE is:
ROE = Net Income ÷ Average Shareholders’ Equity
This ratio is crucial for investors, creditors, and financial analysts as it provides insight into a company’s financial performance and profitability.
A higher ROE suggests that the company is efficiently using its equity base to generate earnings, which is attractive to investors seeking strong returns.
However, an excessively high ROE may indicate high financial leverage, meaning the company relies heavily on debt to boost profits.
A lower ROE may suggest inefficiencies, weak profitability, or underutilization of equity capital.
Analysts compare ROE across industry peers to assess a company’s competitiveness, profitability trends, and overall financial strength.
Return on Common Equity (ROCE)
The Return on Common Equity (ROCE) is a profitability ratio that measures how effectively a company generates profit specifically for its common shareholders.
Unlike Return on Equity (ROE), which includes preferred equity, ROCE focuses solely on the returns available to common shareholders.
The formula for calculating ROCE is:
Return on Common Equity = (Net Income – Preferred Dividends) ÷ Average Common Equity
This ratio is important for investors, creditors, and financial analysts as it provides a clearer picture of the profitability available to common shareholders.
A higher ROCE indicates that the company is effectively using common shareholders’ equity to generate earnings, which can make the stock more attractive to investors.
Conversely, a lower ROCE may suggest weak profitability, inefficient capital use, or excessive financial leverage.
Analysts compare this ratio across industry benchmarks to evaluate whether a company is delivering strong returns to its common shareholders relative to its peers.
Valuation Ratios

Purpose
Valuation ratios help investors, creditors, and financial analysts assess a company’s worth relative to its earnings, cash flow, assets, and dividends.
These ratios provide insight into whether a stock is overvalued, undervalued, or fairly priced in the market, making them crucial for investment decision-making.
By comparing a company’s valuation metrics to industry benchmarks or historical averages, investors can determine potential growth opportunities or risks.
Creditors also consider valuation ratios when assessing a company’s financial stability, as overvaluation may signal excessive market optimism, while undervaluation could indicate underlying financial distress.
Additionally, price-per-share and dividend-related ratios provide further clarity on shareholder returns, measuring earnings distribution and long-term sustainability.
Financial analysts rely on valuation ratios to identify trends, compare companies, and forecast future performance, ensuring a well-rounded approach to investment analysis and corporate valuation.
| Valuation Ratio | Formula | Purpose / What it Measures |
|---|---|---|
| P/E (Price-to-Earnings) | Price per Share ÷ Earnings per Share | Measures how much investors are willing to pay per dollar of earnings; indicates stock valuation. |
| P/CF (Price-to-Cash Flow) | Price per Share ÷ Cash Flow per Share | Evaluates stock price relative to cash flow; useful for companies with volatile earnings. |
| P/S (Price-to-Sales) | Price per Share ÷ Sales per Share | Compares stock price to revenue per share; useful for companies with low or negative earnings. |
| P/BV (Price-to-Book Value) | Price per Share ÷ Book Value per Share | Assesses stock valuation relative to book value; useful for analyzing asset-heavy businesses. |
Price-to-Earnings (P/E) Ratio
The Price-to-Earnings (P/E) Ratio is a valuation ratio that measures the price investors are willing to pay for each unit of a company’s earnings.
It helps assess whether a stock is overvalued, undervalued, or fairly priced relative to its earnings.
The formula for calculating the P/E ratio is:
P/E Ratio = Price per Share ÷ Earnings per Share (EPS)
This ratio is essential for investors, creditors, and financial analysts as it provides insight into market expectations and investor sentiment.
A higher P/E ratio suggests that investors expect strong future growth, but it may also indicate overvaluation if earnings do not justify the price.
Conversely, a lower P/E ratio may signal that the stock is undervalued or that investors have concerns about the company’s future earnings potential.
Analysts compare P/E ratios across industry peers and historical averages to evaluate whether a stock is priced appropriately based on its earnings power and growth prospects.
Price-to-Cash Flow (P/CF) Ratio
The Price-to-Cash Flow (P/CF) Ratio is a valuation ratio that measures how much investors are willing to pay for each unit of a company’s cash flow.
Unlike the Price-to-Earnings (P/E) Ratio, which focuses on net income, P/CF provides a clearer picture of financial health by using cash flow, which is less affected by accounting adjustments.
The formula for calculating the P/CF ratio is:
P/CF Ratio = Price per Share ÷ Cash Flow per Share
This ratio is important for investors, creditors, and financial analysts as it helps assess whether a stock is overvalued or undervalued based on its ability to generate cash.
A lower P/CF ratio may indicate that a stock is undervalued or that the company has strong cash flow relative to its price.
Conversely, a higher P/CF ratio suggests that investors expect significant future growth, but it could also signal overvaluation if cash flow does not increase as anticipated.
Analysts prefer the P/CF ratio over P/E when evaluating companies with volatile earnings or significant non-cash expenses, such as depreciation and amortization.
Price-to-Sales (P/S) Ratio
The Price-to-Sales (P/S) Ratio is a valuation ratio that measures how much investors are willing to pay for each unit of a company’s revenue.
Unlike Price-to-Earnings (P/E), which focuses on profits, the P/S ratio evaluates a company’s valuation based on its total sales, making it useful for companies with fluctuating or negative earnings.
The formula for calculating the P/S ratio is:
P/S Ratio = Price per Share ÷ Sales per Share
This ratio is important for investors, creditors, and financial analysts as it provides insight into how the market values a company’s revenue generation.
A lower P/S ratio may indicate that a stock is undervalued, especially if the company maintains strong revenue growth.
Conversely, a higher P/S ratio suggests that investors expect strong future sales growth, but it may also indicate overvaluation if revenue growth does not materialize.
Analysts use the P/S ratio to compare companies within the same industry, especially when evaluating high-growth firms or those in early stages that have yet to achieve consistent profitability.
Price-to-Book Value (P/BV) Ratio
The Price-to-Book Value (P/BV) Ratio is a valuation ratio that compares a company’s market price to its book value.
It helps assess whether a stock is overvalued or undervalued relative to the net assets recorded on its balance sheet.
The formula for calculating the P/BV ratio is:
P/BV Ratio = Price per Share ÷ Book Value per Share
where Book Value per Share = (Total Assets – Total Liabilities) ÷ Total Shares Outstanding
This ratio is important for investors, creditors, and financial analysts as it provides insight into how much investors are willing to pay for a company’s net assets.
A lower P/BV ratio suggests that a stock may be undervalued, which can be attractive for value investors, especially if the company has strong fundamentals.
Conversely, a higher P/BV ratio may indicate that investors expect strong future growth, but it could also signal overvaluation if earnings and assets do not justify the price.
Analysts use this ratio to compare companies within asset-heavy industries such as banking, real estate, and manufacturing, where book value plays a crucial role in valuation.
| Price Per Share Ratio | Formula | Purpose / What it Measures |
|---|---|---|
| Basic EPS | (Net Income – Preferred Dividends) ÷ Weighted Average Number of Ordinary Shares Outstanding | Measures profitability available to each outstanding ordinary share; fundamental measure of earnings. |
| Diluted EPS | (Net Income – Preferred Dividends + After-tax Interest on Convertible Debt) ÷ (Weighted Average Number of Ordinary Shares Outstanding + Number of Common Shares Issued at Conversion) | Indicates earnings per share if all convertible securities were exercised; reflects worst-case dilution scenario. |
| Cash Flow Per Share | (CFO – Preferred Dividends) ÷ Weighted Average Number of Ordinary Shares Outstanding | Measures operating cash flow generated per share; useful for evaluating liquidity and financial health. |
| EBITDA Per Share | EBITDA ÷ Average Number of Common Stock | Provides insight into earnings before interest, tax, depreciation, and amortization on a per-share basis. |
| Dividends Per Share | Dividends Paid ÷ Number of Shares Outstanding | Represents cash dividends distributed per share; key indicator of return to shareholders. |
Basic Earnings Per Share (Basic EPS)
The Basic Earnings Per Share (Basic EPS) is a profitability ratio that measures the amount of net income available to each outstanding share of common stock.
It represents a company’s per-share profitability and is widely used by investors to assess earnings performance.
The formula for calculating Basic EPS is:
Basic EPS = (Net Income – Preferred Dividends) ÷ Weighted Average Shares Outstanding
This ratio is important for investors, creditors, and financial analysts as it provides insight into a company’s profitability on a per-share basis.
A higher Basic EPS indicates strong earnings generation, making the stock more attractive to investors.
Conversely, a lower Basic EPS suggests weaker profitability, which may raise concerns about financial performance and growth prospects.
Analysts compare Basic EPS across different periods and industry benchmarks to assess earnings trends and determine whether a company’s profitability is improving or declining.
Diluted Earnings Per Share (Diluted EPS)
The Diluted Earnings Per Share (Diluted EPS) is a profitability ratio that measures the amount of net income available to each share of common stock, assuming all potential dilutive securities (such as stock options, convertible bonds, and preferred shares) are exercised.
This ratio provides a conservative estimate of a company’s earnings per share by accounting for potential dilution.
The formula for calculating diluted EPS is:
Diluted EPS = (Net Income – Preferred Dividends) ÷ (Weighted Average Shares Outstanding + Dilutive Securities)
This ratio is important for investors, creditors, and financial analysts as it provides a more accurate measure of a company’s earnings potential if all convertible securities were exercised.
A lower diluted EPS compared to basic EPS suggests that the company has significant potential dilution, which could reduce the value of existing shares.
A higher diluted EPS indicates that the company’s earnings remain strong even after accounting for dilution.
Analysts compare diluted EPS across periods and industry benchmarks to assess a company’s profitability and its impact on shareholder value.
Cash Flow Per Share
The Cash Flow Per Share is a profitability and liquidity ratio that measures the amount of operating cash flow generated per outstanding share of common stock.
Unlike Earnings Per Share (EPS), which is based on net income, this ratio focuses on actual cash generated from operations, providing a clearer picture of a company’s financial strength.
The formula for calculating cash flow per share is:
Cash Flow Per Share = (Cash Flow from Operations – Preferred Dividends) ÷ Weighted Average Shares Outstanding
This ratio is important for investors, creditors, and financial analysts as it highlights a company’s ability to generate cash, which is essential for funding operations, paying dividends, and servicing debt.
A higher cash flow per share suggests strong cash generation, which can support growth, reduce reliance on external financing, and enhance shareholder value.
A lower cash flow per share may indicate weaker cash flow management or financial strain, raising concerns about liquidity and sustainability.
Analysts compare this ratio across industry benchmarks to assess a company’s financial health and its ability to generate cash independent of accounting adjustments.
EBITDA Per Share
The EBITDA Per Share is a profitability ratio that measures a company’s Earnings Before Interest, Taxes, Depreciation, and Amortization (EBITDA) on a per-share basis.
It provides insight into a company’s operational profitability before the impact of non-cash expenses and financing costs.
The formula for calculating EBITDA per share is:
EBITDA Per Share = EBITDA ÷ Weighted Average Shares Outstanding
This ratio is important for investors, creditors, and financial analysts as it highlights a company’s core profitability and cash-generating ability before accounting for capital structure and tax considerations.
A higher EBITDA per share suggests strong operational performance and the ability to generate earnings from core business activities, which can be attractive to investors.
A lower EBITDA per share may indicate weaker profitability, inefficiencies, or rising operating costs.
Analysts often compare this ratio to industry benchmarks to evaluate a company’s earnings potential and financial stability while excluding accounting differences in depreciation and amortization methods.
Dividends Per Share (DPS)
The Dividends Per Share (DPS) is a profitability and shareholder return ratio that measures the amount of dividends a company pays out to each outstanding share of common stock.
It reflects the portion of earnings distributed to shareholders and is a key indicator of a company’s commitment to returning value to investors.
The formula for calculating DPS is:
Dividends Per Share = Total Dividends Paid ÷ Number of Shares Outstanding
This ratio is important for investors, creditors, and financial analysts as it provides insight into a company’s dividend policy, profitability, and financial health.
A higher DPS indicates that the company is generating sufficient profits and cash flow to reward shareholders, making it attractive to income-focused investors.
However, if a company pays out too much in dividends, it may limit reinvestment opportunities for growth.
A lower DPS may suggest that the company is prioritizing reinvestment over distributions, which could be beneficial for long-term expansion but less appealing to dividend-seeking investors.
Analysts compare DPS trends over time and across industry peers to evaluate dividend sustainability and overall shareholder returns.
| Dividend-Related Ratio | Formula | Purpose / What it Measures |
|---|---|---|
| Dividend Payout Ratio | Common Share Dividends ÷ Net Income Attributable to Common Shares | Measures the percentage of earnings distributed as dividends; indicates dividend policy and sustainability. |
| Retention Rate (b) | (Net Income Attributable to Common Shares – Common Share Dividends) ÷ Net Income Attributable to Common Shares | Indicates the proportion of earnings retained for reinvestment; complements the payout ratio. |
| Sustainable Growth Rate | b × ROE | Estimates the maximum growth rate a company can achieve without external financing. |
Dividend Payout Ratio
The Dividend Payout Ratio is a profitability and shareholder return ratio that measures the percentage of a company’s earnings distributed to shareholders in the form of dividends.
It indicates how much of a company’s net income is being returned to investors versus how much is being retained for reinvestment.
The formula for calculating the dividend payout ratio is:
Dividend Payout Ratio = Dividends per Share ÷ Earnings per Share (EPS)
or
Dividend Payout Ratio = Total Dividends Paid ÷ Net Income
This ratio is important for investors, creditors, and financial analysts as it provides insights into a company’s dividend policy and financial stability.
A higher dividend payout ratio suggests that a company is returning a large portion of its earnings to shareholders, which can be attractive to income-focused investors.
However, if the payout ratio is too high, it may signal that the company is not reinvesting enough in future growth or could struggle to maintain dividends during economic downturns.
A lower dividend payout ratio indicates that the company is retaining more earnings for expansion, debt reduction, or other strategic investments, which may appeal to growth-focused investors.
Analysts use this ratio to assess dividend sustainability and compare a company’s approach to distributing earnings against industry peers.
Retention Rate
The Retention Rate, also known as the Plowback Ratio, is a profitability ratio that measures the percentage of a company’s earnings that is retained and reinvested in the business rather than paid out as dividends to shareholders.
It is the complement of the Dividend Payout Ratio and reflects a company’s strategy for growth and capital expansion.
The formula for calculating the retention rate is:
Retention Rate = 1 – Dividend Payout Ratio
or
Retention Rate = (Net Income – Dividends Paid) ÷ Net Income
This ratio is important for investors, creditors, and financial analysts as it provides insight into a company’s reinvestment strategy and long-term growth potential.
A higher retention rate suggests that the company is prioritizing internal growth, funding expansion projects, or strengthening its financial position.
This can be appealing to growth-focused investors but may be less attractive to income-seeking investors who prefer dividends.
A lower retention rate indicates that the company is returning more earnings to shareholders, which may be beneficial for those looking for consistent income but could limit future growth opportunities.
Analysts compare the retention rate across industry peers to evaluate a company’s approach to balancing shareholder returns with reinvestment in future profitability.
Sustainable Growth Rate (SGR)
The Sustainable Growth Rate (SGR) is a profitability and growth metric that estimates the maximum rate at which a company can grow its revenue, earnings, and dividends without requiring additional external financing.
It is based on the company’s ability to reinvest earnings while maintaining its current capital structure.
The formula for calculating the sustainable growth rate is:
Sustainable Growth Rate = Retention Rate × Return on Equity (ROE)
or
SGR = (1 – Dividend Payout Ratio) × ROE
This ratio is important for investors, creditors, and financial analysts as it provides insight into a company’s capacity for self-funded expansion.
A higher SGR indicates that the company can grow at a strong pace without needing to raise external debt or issue new equity, making it attractive for long-term investors.
A lower SGR suggests that the company may need external financing to support its growth, which could lead to higher financial leverage and increased risk.
Analysts compare the sustainable growth rate across industries to determine whether a company’s growth strategy is financially viable and aligned with its profitability and capital management approach.
Credit Ratios
Purpose
Credit ratios assess a company’s ability to manage and service its debt obligations, providing key insights into financial stability and creditworthiness.
These ratios are essential for investors, creditors, and financial analysts as they help evaluate a company’s risk profile, debt burden, and capacity to generate sufficient cash flow for debt repayment.
Strong credit metrics indicate a company’s ability to meet its financial commitments, reducing the risk of default and making it more attractive to lenders and bond investors.
For equity investors, credit ratios offer insight into a company’s financial leverage and potential risks associated with excessive debt, which can impact profitability and long-term growth prospects.
Creditors use these ratios to determine lending terms, interest rates, and credit limits, ensuring they extend financing to financially sound businesses.
Financial analysts rely on credit ratios to compare companies, assess industry trends, and forecast financial health, making them a critical component of comprehensive risk assessment and investment analysis.
| Credit Ratio | Formula | Purpose / What it Measures |
|---|---|---|
| EBIT Interest Coverage | EBIT ÷ Gross Interest | Measures a company's ability to cover interest payments using operating earnings. |
| EBITDA Interest Coverage | EBITDA ÷ Gross Interest | Shows interest coverage with non-cash depreciation and amortization included in earnings. |
| FFO Interest Coverage | (FFO + Interest Paid – Operating Lease Adjustments) ÷ Gross Interest | Measures a company's ability to meet interest payments using funds from operations. |
| Return on Capital | EBIT ÷ Average Capital (Equity + Non-current Deferred Taxes + Debt) | Evaluates efficiency in generating returns from all capital sources. |
| FFO to Debt | FFO ÷ Total Debt | Measures how much cash flow is available relative to outstanding debt obligations. |
| Free Operating Cash Flow-to-Debt | (CFO Adjusted – Capital Expenditures) ÷ Total Debt | Indicates the portion of cash flow available after essential investments to service debt. |
| Discretionary Cash Flow-to-Debt | (CFO – Capital Expenditures – Dividends Paid) ÷ Total Debt | Assesses a company's ability to pay debt after capital expenditures and dividends. |
| Net Cash Flow-to-Capital Expenditures | (FFO – Dividends) ÷ Capital Expenditures | Shows the proportion of cash flow available to reinvest in the business after dividends. |
EBIT Interest Coverage
The EBIT Interest Coverage Ratio is a coverage ratio that measures a company’s ability to meet its interest obligations using its Earnings Before Interest and Taxes (EBIT).
It indicates how easily a company can cover its interest expenses with its operating profits before considering tax and debt costs.
The formula for calculating EBIT interest coverage is:
EBIT Interest Coverage = EBIT ÷ Interest Expense
This ratio is important for investors, creditors, and financial analysts as it provides insight into a company’s financial stability and risk of default.
A higher EBIT interest coverage ratio suggests that the company generates sufficient operating income to comfortably cover its interest payments, reducing financial risk.
Conversely, a lower EBIT interest coverage ratio may indicate financial strain, suggesting that the company could struggle to meet its debt obligations, especially in times of declining earnings.
If the ratio falls below 1, it means that the company’s EBIT is insufficient to cover interest expenses, signaling potential liquidity issues.
Analysts compare this ratio across industries and historical data to assess financial health, debt management, and overall creditworthiness.
EBITDA Interest Coverage
The EBITDA Interest Coverage Ratio is a coverage ratio that measures a company’s ability to meet its interest obligations using its Earnings Before Interest, Taxes, Depreciation, and Amortization (EBITDA).
This ratio provides a clearer picture of a company’s ability to cover interest payments by excluding non-cash expenses like depreciation and amortization.
The formula for calculating EBITDA interest coverage is:
EBITDA Interest Coverage = EBITDA ÷ Interest Expense
This ratio is important for investors, creditors, and financial analysts as it assesses a company’s financial stability and debt-servicing ability.
A higher EBITDA interest coverage ratio indicates that the company has strong cash flow relative to its interest obligations, reducing financial risk.
Conversely, a lower ratio may suggest that the company is at risk of struggling to meet its interest payments, which could lead to financial distress or difficulty securing future financing.
Analysts prefer this ratio over EBIT Interest Coverage when assessing companies with high depreciation and amortization expenses, such as capital-intensive industries, as it focuses on cash-generating capability rather than accounting-based earnings.
FFO Interest Coverage
The Funds From Operations (FFO) Interest Coverage Ratio is a coverage ratio that measures a company’s ability to cover its interest expenses using its Funds From Operations (FFO).
This ratio is particularly useful for companies with significant non-cash expenses, such as real estate investment trusts (REITs) and capital-intensive businesses, as it focuses on cash flow rather than accounting-based earnings.
The formula for calculating FFO interest coverage is:
FFO Interest Coverage = Funds From Operations (FFO) ÷ Interest Expense
This ratio is important for investors, creditors, and financial analysts as it provides insight into a company’s financial flexibility and ability to service its debt obligations from recurring cash flows.
A higher FFO interest coverage ratio indicates that the company generates sufficient cash flow to cover its interest payments, reducing credit risk and financial distress.
A lower ratio suggests that the company may have difficulty meeting its interest obligations, raising concerns about liquidity and leverage.
Analysts use this ratio to evaluate companies with high depreciation and amortization expenses, where traditional earnings-based interest coverage ratios may not provide an accurate picture of debt-servicing capacity.
Return on Capital (ROC)
The Return on Capital (ROC) is a profitability ratio that measures how efficiently a company generates returns from the capital it has invested in its operations.
It provides insight into how well a company is using both debt and equity to generate profits before financing costs.
The formula for calculating return on capital is:
Return on Capital = EBIT ÷ (Total Debt + Total Shareholders’ Equity)
This ratio is important for investors, creditors, and financial analysts as it evaluates a company’s efficiency in deploying capital to generate earnings.
A higher ROC indicates that the company is effectively using its capital to create value, making it attractive for investors.
Conversely, a lower ROC may suggest inefficiencies in capital utilization, excessive debt, or low profitability.
Analysts compare this ratio across industries to assess whether a company’s returns justify its capital structure and whether management is allocating resources effectively to maximize shareholder value.
FFO to Debt
The Funds From Operations (FFO) to Debt Ratio is a solvency ratio that measures a company’s ability to repay its total debt using its Funds From Operations (FFO).
This ratio is particularly useful for evaluating companies with significant non-cash expenses, such as real estate investment trusts (REITs) and capital-intensive industries, as it focuses on cash flow rather than accounting-based earnings.
The formula for calculating FFO to Debt is:
FFO to Debt = Funds From Operations (FFO) ÷ Total Debt
This ratio is crucial for investors, creditors, and financial analysts as it provides insight into a company’s financial flexibility and its ability to manage long-term debt obligations.
A higher FFO to Debt ratio indicates that the company generates strong cash flows relative to its debt levels, reducing credit risk and improving its ability to meet financial commitments.
A lower ratio suggests that the company may face difficulties in covering its debt obligations, raising concerns about financial stability and leverage.
Analysts compare this ratio across industry peers to assess a company’s debt sustainability and overall creditworthiness.
Free Operating Cash Flow-to-Debt
The Free Operating Cash Flow-to-Debt Ratio is a solvency ratio that measures a company’s ability to repay its total debt using its free operating cash flow (FOCF).
This ratio is particularly useful for evaluating a company’s long-term financial health, as it focuses on cash flow available after necessary capital expenditures, rather than accounting-based earnings.
The formula for calculating Free Operating Cash Flow-to-Debt is:
Free Operating Cash Flow-to-Debt = Free Operating Cash Flow (FOCF) ÷ Total Debt
where:
FOCF = Cash Flow from Operations – Capital Expenditures
This ratio is important for investors, creditors, and financial analysts as it provides insight into a company’s ability to generate excess cash flow to manage and reduce its debt obligations.
A higher Free Operating Cash Flow-to-Debt ratio suggests that the company has strong cash flow generation relative to its debt, reducing credit risk and improving financial stability.
A lower ratio indicates that the company may struggle to generate enough cash flow to service its debt, raising concerns about liquidity and leverage.
Analysts use this ratio to assess a company’s financial flexibility, debt sustainability, and ability to fund future growth without relying on external financing.
Discretionary Cash Flow-to-Debt
The Discretionary Cash Flow-to-Debt Ratio is a solvency ratio that measures a company’s ability to cover its total debt obligations using its discretionary cash flow (DCF).
This ratio is particularly useful for evaluating a company’s financial flexibility after accounting for both capital expenditures and dividend payments.
The formula for calculating Discretionary Cash Flow-to-Debt is:
Discretionary Cash Flow-to-Debt = Discretionary Cash Flow (DCF) ÷ Total Debt
where:
DCF = Free Operating Cash Flow – Dividends Paid
This ratio is crucial for investors, creditors, and financial analysts as it provides insight into a company’s ability to generate excess cash flow beyond operational and shareholder obligations to manage and reduce debt.
A higher Discretionary Cash Flow-to-Debt ratio suggests that the company has strong financial flexibility and can comfortably meet debt obligations while still investing in growth.
A lower ratio indicates that the company may have limited financial flexibility, as much of its cash flow is allocated to dividends or capital expenditures, leaving less room for debt reduction.
Analysts compare this ratio across industries to assess a company’s ability to sustain its debt load while balancing shareholder returns and reinvestment strategies.
Net Cash Flow-to-Capital Expenditures (NCF-to-CapEx)
The Net Cash Flow-to-Capital Expenditures (NCF-to-CapEx) Ratio is a solvency and investment efficiency ratio that measures a company’s ability to finance its capital expenditures using its net cash flow.
It evaluates whether a company generates sufficient cash to fund its investments in long-term assets without relying on external financing.
The formula for calculating this ratio is:
Net Cash Flow-to-Capital Expenditures = Net Cash Flow ÷ Capital Expenditures (CapEx)
This ratio is important for investors, creditors, and financial analysts as it provides insight into a company’s reinvestment capabilities and financial sustainability.
A higher NCF-to-CapEx ratio suggests that the company generates enough cash internally to fund its capital investments, reducing reliance on debt or equity financing.
A lower ratio indicates that the company may need to borrow or raise additional funds to support its growth initiatives, which could increase financial risk.
Analysts use this ratio to assess a company’s long-term investment strategy and its ability to maintain or expand operations without straining its financial resources.
Leverage Ratios
Purpose
Leverage ratios measure the extent to which a company relies on borrowed funds to finance its operations and growth.
These ratios are crucial for investors, creditors, and financial analysts as they provide insights into a company’s financial risk, capital structure, and ability to meet long-term obligations.
A well-balanced level of leverage can enhance returns for shareholders by using debt to fuel expansion, while excessive leverage increases financial risk and the likelihood of default.
Investors use leverage ratios to assess the sustainability of earnings and potential for growth, ensuring that debt levels are manageable relative to the company’s profitability.
Creditors analyze these ratios to determine lending risk and set borrowing terms, as higher leverage may indicate greater financial strain.
Financial analysts rely on leverage ratios to compare companies within an industry, evaluate financial health, and assess a firm’s resilience to economic downturns.
Understanding leverage is essential for making informed decisions about investment, lending, and risk management.
| Solvency Ratio | Formula | Purpose / What it Measures |
|---|---|---|
| Debt-to-Assets | Total Debt ÷ Total Assets | Proportion of assets financed by debt; measures company's overall leverage. |
| Debt-to-Capital | Total Debt ÷ (Total Debt + Total Shareholders' Equity) | Portion of capital structure funded by debt; indicates financial structure and solvency risk. |
| Debt-to-Equity | Total Debt ÷ Total Shareholders' Equity | Relationship between debt financing and equity financing; assesses financial leverage and risk. |
| Financial Leverage | Average Total Assets ÷ Total Shareholders' Equity | Degree to which a company uses equity capital to finance its assets; higher leverage implies higher risk. |
Debt-to-Assets
The Debt-to-Assets Ratio is a solvency ratio that measures the proportion of a company’s total assets that are financed by debt.
It provides insight into a company’s financial leverage and long-term stability by assessing how much of its asset base is funded through borrowing rather than equity.
The formula for calculating the debt-to-assets ratio is:
Debt-to-Assets = Total Debt ÷ Total Assets
This ratio is crucial for investors, creditors, and financial analysts as it helps evaluate a company’s financial risk and capital structure.
A higher debt-to-assets ratio indicates that a significant portion of the company’s assets is financed through debt, which may increase financial risk, especially in economic downturns.
However, moderate levels of debt can be beneficial if used efficiently to drive growth and generate higher returns.
A lower debt-to-assets ratio suggests that a company relies more on equity financing, reducing financial risk but potentially limiting growth opportunities.
Analysts compare this ratio across industry benchmarks to determine whether a company is managing its leverage effectively and maintaining a sustainable capital structure.
Debt-to-Capital
The Debt-to-Capital Ratio is a solvency ratio that measures the proportion of a company’s total capital that comes from debt financing.
It provides insight into a company’s financial structure and risk exposure by comparing debt to the total capital available.
The formula for calculating the debt-to-capital ratio is:
Debt-to-Capital = Total Debt ÷ (Total Debt + Total Shareholders’ Equity)
This ratio is crucial for investors, creditors, and financial analysts as it helps determine a company’s financial leverage and ability to meet long-term obligations.
A higher debt-to-capital ratio indicates that the company is more reliant on debt financing, which may increase financial risk, particularly if earnings decline or interest rates rise.
However, some industries with stable cash flows, such as utilities, can sustain higher debt levels efficiently.
A lower debt-to-capital ratio suggests a stronger reliance on equity financing, reducing financial risk but potentially limiting the ability to scale operations quickly.
Analysts compare this ratio across industry peers to assess whether a company’s capital structure aligns with its growth strategy and financial health.
Debt-to-Equity (D/E) Ratio
The Debt-to-Equity (D/E) Ratio is a solvency ratio that measures the proportion of a company’s financing that comes from debt versus equity.
It helps assess a company’s financial leverage and risk exposure by comparing total debt to shareholders’ equity.
The formula for calculating the debt-to-equity ratio is:
Debt-to-Equity = Total Debt ÷ Total Shareholders’ Equity
This ratio is important for investors, creditors, and financial analysts as it provides insight into a company’s financial stability and capital structure.
A higher debt-to-equity ratio suggests that a company relies more on debt financing, which can amplify returns but also increases financial risk and interest obligations.
If the ratio is too high, it may indicate potential solvency issues, particularly during economic downturns.
A lower debt-to-equity ratio signifies a stronger reliance on equity financing, reducing financial risk but possibly limiting growth opportunities.
Analysts compare this ratio across industries to determine whether a company’s leverage level is appropriate for its business model and risk tolerance.
Financial Leverage
The Financial Leverage Ratio is a solvency ratio that measures the degree to which a company uses debt to finance its assets.
It indicates how dependent a company is on borrowed capital and provides insight into financial risk and potential return on equity.
The formula for calculating financial leverage is:
Financial Leverage = Average Total Assets ÷ Average Total Shareholders’ Equity
This ratio is important for investors, creditors, and financial analysts as it reflects a company’s capital structure and risk exposure.
A higher financial leverage ratio suggests that a company is using more debt to finance its assets, which can amplify returns for shareholders but also increases financial risk, particularly if earnings decline or interest rates rise.
A lower financial leverage ratio indicates a stronger reliance on equity financing, reducing financial risk but potentially limiting the ability to scale operations quickly.
Analysts compare this ratio to industry benchmarks to assess whether a company’s leverage level is appropriate for its business model and growth strategy.
Segment Ratios
Purpose
Segment ratios provide valuable insights into the performance, profitability, and financial health of different business divisions within a company.
These ratios are essential for investors, creditors, and financial analysts as they help assess how effectively each segment contributes to overall corporate performance.
By breaking down financial data at the segment level, investors can identify which business units are driving growth and which may be underperforming, enabling more informed investment decisions.
Creditors use segment ratios to evaluate the financial stability of key revenue-generating divisions, ensuring that a company’s ability to meet debt obligations is not overly reliant on a single segment.
Financial analysts rely on these ratios to compare the efficiency, profitability, and risk exposure of various segments within a company or industry, providing a clearer picture of long-term sustainability.
Understanding segment ratios allows stakeholders to pinpoint strengths, address weaknesses, and make strategic decisions based on a more detailed financial assessment.
| Segment Ratio | Formula | Indication |
|---|---|---|
| Segment Margin | Segment Profit (Loss) ÷ Segment Revenue | Measures a segment’s profitability relative to its revenues. |
| Segment Turnover | Segment Revenue ÷ Segment Assets | Measures a segment’s ability to generate revenue using assets. |
| Segment ROA | Segment Profit (Loss) ÷ Segment Assets | Measures a segment’s operating profitability relative to its assets. |
| Segment Debt Ratio | Segment Liabilities ÷ Segment Assets | Measures segment solvency. |
Segment Margin
The Segment Margin is a profitability ratio that measures the profitability of a specific business segment within a company.
It helps assess how much profit a particular segment generates relative to its revenue, providing insight into the financial performance of different divisions.
The formula for calculating segment margin is:
Segment Margin = Segment Profit (or Operating Profit) ÷ Segment Revenue
This ratio is important for investors, creditors, and financial analysts as it helps evaluate the efficiency and profitability of individual business units.
A higher segment margin indicates that a segment is generating strong profits relative to its sales, which can highlight competitive advantages or strong market positioning.
A lower segment margin suggests that a segment may be underperforming due to high costs, pricing pressures, or operational inefficiencies.
Analysts use this ratio to compare the profitability of different segments within a company, identify areas for improvement, and assess how well management is allocating resources to maximize overall business performance.
Segment Turnover
The Segment Turnover is an efficiency ratio that measures how effectively a business segment utilizes its assets to generate revenue.
It provides insight into the operational efficiency of individual divisions within a company by assessing how well they convert assets into sales.
The formula for calculating segment turnover is:
Segment Turnover = Segment Revenue ÷ Segment Assets
This ratio is important for investors, creditors, and financial analysts as it helps evaluate the productivity and efficiency of different business units.
A higher segment turnover indicates that a segment is efficiently using its assets to generate revenue, which may suggest strong demand, effective asset utilization, or streamlined operations.
Conversely, a lower segment turnover may indicate inefficiencies, underutilized assets, or weak sales performance within that segment.
Analysts use this ratio to compare business units within the same company, track performance trends, and assess whether management is optimizing asset deployment across different segments.
Segment Return on Assets (Segment ROA)
The Segment Return on Assets (Segment ROA) is a profitability ratio that measures how efficiently a specific business segment generates profit relative to its asset base.
It helps assess the financial performance of individual divisions within a company by evaluating how well they utilize their assets to create earnings.
The formula for calculating Segment ROA is:
Segment ROA = Segment Profit ÷ Segment Assets
This ratio is important for investors, creditors, and financial analysts as it provides insight into which business segments are the most efficient at generating returns.
A higher Segment ROA indicates that a division is effectively using its assets to produce strong earnings, which can highlight its competitive advantage or operational efficiency.
Conversely, a lower Segment ROA may suggest underperformance, excessive capital investment, or poor asset utilization.
Analysts use this ratio to compare the profitability of different business units within a company, assess management’s resource allocation strategy, and identify potential areas for operational improvement.
Segment Debt Ratio
The Segment Debt Ratio is a solvency ratio that measures the proportion of a specific business segment’s assets that are financed through debt.
It provides insight into the financial leverage and risk profile of individual divisions within a company.
The formula for calculating the segment debt ratio is:
Segment Debt Ratio = Segment Liabilities ÷ Segment Assets
This ratio is important for investors, creditors, and financial analysts as it helps assess the financial health and stability of different business units.
A higher segment debt ratio indicates that a segment relies more on debt financing, which could increase financial risk, especially during downturns.
Conversely, a lower segment debt ratio suggests that a segment is less leveraged, reducing financial risk but potentially limiting growth opportunities.
Analysts use this ratio to compare financial risk across business units, evaluate how management allocates debt within the company, and determine whether a segment’s debt levels are sustainable given its profitability and cash flow generation.
Performance Ratios
Purpose
Performance ratios evaluate a company’s ability to generate cash flow, manage financial obligations, and sustain long-term growth.
These ratios are crucial for investors, creditors, and financial analysts as they provide insights into operational efficiency, profitability, and financial resilience.
Investors use performance ratios to assess how effectively a company converts its resources into revenue and profits, helping them determine potential returns and long-term sustainability.
Creditors rely on these ratios to evaluate a firm’s ability to generate sufficient cash flow to service debt, ensuring financial stability and reducing default risk.
Financial analysts utilize performance ratios to compare companies within an industry, identify trends, and forecast future performance.
By analyzing these metrics, stakeholders can gauge a company’s financial health, operational strength, and capacity for reinvestment, ultimately guiding more informed investment, lending, and strategic decisions.
| Performance Ratio | Formula | Indication |
|---|---|---|
| Cash Flow to Revenue | CFO ÷ Net Revenue | Operating cash generated per dollar of revenue. |
| Cash Return on Assets | CFO ÷ Average Total Assets | Operating cash generated per dollar of asset investment. |
| Cash Return on Equity | CFO ÷ Average Shareholders' Equity | Operating cash generated per dollar of owner investment. |
| Cash to Income | CFO ÷ Operating Income | Cash generated from operations. |
| Cash Flow per Share | (CFO – Preferred Dividends) ÷ Number of Common Shares Outstanding | Operating cash flow on a per-share basis. |
| Debt Payment | CFO ÷ Cash Paid for Long-term Debt Repayment | Ability to pay debts with operating cash flows. |
| Dividend Payment | CFO ÷ Dividends Paid | Ability to pay dividends with operating cash flows. |
| Investing and Financing | CFO ÷ Cash Outflows for Investing and Financing Activities | Ability to acquire assets, pay debts, and make distributions to owners. |
| Debt Coverage | CFO ÷ Total Debt | Financial risk and financial leverage. |
| Interest Coverage | (CFO + Interest Paid + Taxes Paid) ÷ Interest Paid | Ability to meet interest obligations. |
| Reinvestment | CFO ÷ Cash Paid for Long-term Assets | Ability to acquire assets with operating cash flows. |
Cash Flow-to-Revenue
The Cash Flow-to-Revenue Ratio is an efficiency ratio that measures how effectively a company converts its revenue into operating cash flow.
It provides insight into a company’s ability to generate cash from its sales, which is crucial for maintaining liquidity and funding operations.
The formula for calculating cash flow-to-revenue is:
Cash Flow-to-Revenue = Cash Flow from Operations ÷ Revenue
This ratio is important for investors, creditors, and financial analysts as it helps evaluate the quality of a company’s earnings.
A higher cash flow-to-revenue ratio indicates strong cash generation, suggesting that revenue is being efficiently converted into cash, which reduces reliance on external financing.
Conversely, a lower ratio may suggest weak cash flow management, aggressive revenue recognition, or high working capital requirements.
Analysts compare this ratio across industry peers to assess a company’s financial health, operational efficiency, and ability to sustain growth without excessive debt.
Cash Return on Assets (Cash ROA)
The Cash Return on Assets (Cash ROA) is a profitability ratio that measures how efficiently a company generates cash flow from its total assets.
It provides insight into how well a company converts its assets into operating cash, which is crucial for funding operations, paying debts, and reinvesting in growth.
The formula for calculating cash return on assets is:
Cash ROA = Cash Flow from Operations ÷ Average Total Assets
This ratio is important for investors, creditors, and financial analysts as it helps assess a company’s ability to generate cash relative to its asset base.
A higher Cash ROA indicates strong cash generation efficiency, suggesting that the company effectively manages its resources to support operations and growth.
Conversely, a lower Cash ROA may indicate weak cash flow management, high asset intensity, or inefficiencies in converting assets into cash.
Analysts use this ratio to compare companies within the same industry to determine financial strength, cash flow sustainability, and overall operational effectiveness.
Cash Return on Equity (Cash ROE)
The Cash Return on Equity (Cash ROE) is a profitability ratio that measures how efficiently a company generates operating cash flow relative to its shareholders’ equity.
It provides insight into a company’s ability to generate cash returns for its investors, offering a more cash-focused alternative to the traditional Return on Equity (ROE), which is based on net income.
The formula for calculating Cash ROE is:
Cash ROE = Cash Flow from Operations ÷ Average Shareholders’ Equity
This ratio is important for investors, creditors, and financial analysts as it evaluates the financial health and cash-generating efficiency of a company.
A higher Cash ROE indicates strong cash flow generation relative to equity, suggesting effective management and financial strength.
Conversely, a lower Cash ROE may signal weak cash flow performance, inefficient capital use, or high working capital requirements.
Analysts use this ratio to compare companies across industries, assess financial sustainability, and determine whether a company is creating real value for shareholders through cash-based returns rather than just accounting profits.
Cash-to-Income
The Cash-to-Income Ratio is a profitability and efficiency ratio that measures how much of a company’s operating income is converted into actual operating cash flow.
It helps assess the quality of earnings by comparing cash flow to accounting-based income.
The formula for calculating the cash-to-income ratio is:
Cash-to-Income = Cash Flow from Operations ÷ Operating Income (EBIT)
This ratio is important for investors, creditors, and financial analysts as it provides insight into how well a company’s earnings translate into cash.
A higher cash-to-income ratio suggests that a company’s reported earnings are backed by strong cash flow, reducing the risk of earnings manipulation and improving financial stability.
Conversely, a lower ratio may indicate that a company’s income is heavily dependent on non-cash accruals, which could raise concerns about the sustainability of reported profits.
Analysts use this ratio to evaluate earnings quality, cash flow efficiency, and a company’s ability to meet financial obligations without relying on external financing.
Cash Flow Per Share
The Cash Flow Per Share is a profitability and liquidity ratio that measures the amount of operating cash flow generated per outstanding share of common stock.
Unlike Earnings Per Share (EPS), which is based on net income, this ratio focuses on actual cash generated from operations, providing a clearer picture of a company’s financial strength.
The formula for calculating cash flow per share is:
Cash Flow Per Share = (Cash Flow from Operations – Preferred Dividends) ÷ Weighted Average Shares Outstanding
This ratio is important for investors, creditors, and financial analysts as it highlights a company’s ability to generate cash, which is essential for funding operations, paying dividends, and servicing debt.
A higher cash flow per share suggests strong cash generation, which can support growth, reduce reliance on external financing, and enhance shareholder value.
A lower cash flow per share may indicate weaker cash flow management or financial strain, raising concerns about liquidity and sustainability.
Analysts compare this ratio across industry benchmarks to assess a company’s financial health and its ability to generate cash independent of accounting adjustments.
Debt Payment Ratio
The Debt Payment Ratio is a solvency ratio that measures a company’s ability to meet its debt obligations using its operating cash flow.
It provides insight into how much of a company’s cash flow is allocated toward repaying debt, helping assess financial stability and credit risk.
The formula for calculating the debt payment ratio is:
Debt Payment Ratio = Principal Debt Payments ÷ Cash Flow from Operations
This ratio is important for investors, creditors, and financial analysts as it indicates whether a company generates sufficient cash to service its debt without relying on external financing.
A lower debt payment ratio suggests that the company has a manageable debt burden, leaving more cash available for growth, dividends, or other investments.
Conversely, a higher ratio may indicate that a significant portion of cash flow is being used to pay off debt, potentially limiting financial flexibility and increasing default risk.
Analysts use this ratio to evaluate a company’s financial resilience and ability to sustain long-term debt repayment.
Dividend Payment Ratio
The Dividend Payment Ratio is a profitability and shareholder return ratio that measures the proportion of a company’s operating cash flow or net income that is paid out to shareholders in the form of dividends.
It helps assess the sustainability of a company’s dividend policy.
The formula for calculating the dividend payment ratio is:
Dividend Payment Ratio = Dividends Paid ÷ Net Income
or
Dividend Payment Ratio = Dividends Paid ÷ Cash Flow from Operations (for a cash-based approach)
This ratio is important for investors, creditors, and financial analysts as it provides insight into a company’s commitment to returning value to shareholders while balancing reinvestment for growth.
A higher dividend payment ratio suggests that a significant portion of earnings is being distributed to shareholders, which can be attractive to income-focused investors but may limit future expansion.
A lower ratio indicates that the company is retaining more earnings for reinvestment, which could be beneficial for long-term growth but less appealing to dividend-seeking investors.
Analysts use this ratio to evaluate dividend sustainability and compare a company’s payout strategy to industry peers.
Investing and Financing Ratio
The Investing and Financing Ratio is a liquidity and capital allocation metric that measures the proportion of a company’s operating cash flow that is allocated toward investing in capital expenditures (CapEx) and financing activities, such as debt repayments or dividend distributions.
It helps assess how a company balances its growth investments with financial obligations.
The formula for calculating this ratio is:
Investing and Financing Ratio = (Capital Expenditures + Debt Repayments + Dividends Paid) ÷ Cash Flow from Operations
This ratio is important for investors, creditors, and financial analysts as it provides insight into a company’s cash flow management strategy.
A higher investing and financing ratio suggests that the company is heavily using its operating cash flow for reinvestment and financial commitments, which could indicate growth potential but may also strain liquidity.
A lower ratio indicates that the company retains more cash, which can enhance financial flexibility and stability but might also suggest underinvestment in future growth.
Analysts use this ratio to evaluate whether a company is maintaining a sustainable balance between funding expansion and meeting financial obligations.
Debt Coverage Ratio
The Debt Coverage Ratio is a solvency ratio that measures a company’s ability to generate enough cash flow to cover its total debt obligations, including both principal and interest payments.
It helps assess financial stability and the risk of default.
The formula for calculating the debt coverage ratio is:
Debt Coverage Ratio = Cash Flow from Operations ÷ Total Debt
This ratio is important for investors, creditors, and financial analysts as it provides insight into a company’s ability to manage its debt load with internally generated cash flow.
A higher debt coverage ratio indicates strong cash flow generation relative to debt, reducing financial risk and making the company more attractive to lenders.
Conversely, a lower ratio suggests that the company may struggle to meet its debt obligations, which could lead to liquidity issues or the need for additional financing.
Analysts use this ratio to compare companies within an industry and assess overall financial health and creditworthiness.
Interest Coverage Ratio
The Interest Coverage Ratio is a solvency ratio that measures a company’s ability to pay its interest expenses using its operating earnings.
It indicates how easily a company can cover its interest obligations before taxes and other financial costs.
The formula for calculating the interest coverage ratio is:
Interest Coverage Ratio = EBIT ÷ Interest Expense
where:
EBIT = Earnings Before Interest and Taxes
This ratio is important for investors, creditors, and financial analysts as it provides insight into a company’s financial stability and credit risk.
A higher interest coverage ratio indicates that a company generates sufficient earnings to comfortably cover interest payments, reducing the likelihood of financial distress.
Conversely, a lower ratio suggests that the company may struggle to meet its interest obligations, increasing the risk of default or financial instability.
If the ratio falls below 1, it means the company’s earnings are insufficient to cover interest expenses, signaling potential liquidity issues.
Analysts use this ratio to compare companies within an industry and assess their ability to manage debt effectively.
Reinvestment Ratio
The Reinvestment Ratio is an efficiency and growth ratio that measures the percentage of a company’s operating cash flow that is reinvested into the business through capital expenditures (CapEx).
It helps assess how much of a company’s internally generated funds are used to support future growth.
The formula for calculating the reinvestment ratio is:
Reinvestment Ratio = Capital Expenditures ÷ Cash Flow from Operations
This ratio is important for investors, creditors, and financial analysts as it provides insight into a company’s long-term growth strategy and capital allocation efficiency.
A higher reinvestment ratio suggests that the company is aggressively reinvesting in its infrastructure, expansion, or technology, which may indicate strong growth potential.
However, if reinvestment is too high, it could strain liquidity and limit cash available for debt repayments or shareholder returns.
A lower reinvestment ratio may indicate that the company is more focused on maintaining financial flexibility, returning cash to shareholders, or reducing debt rather than expanding operations.
Analysts compare this ratio across industries to evaluate whether a company’s reinvestment levels align with its growth objectives and financial health.
The Role of Financial Ratios in the CFA Exams
The CFA exams are known for their rigor, and financial ratios are a key component of this challenging curriculum. Whether in the context of equity analysis, corporate finance, or portfolio management, you’ll find financial ratios embedded in the questions you encounter.
Level I: Building the Foundation
In Level I of the CFA program, you’ll focus on the fundamentals of financial ratios. You’ll need to memorize the formulas and understand how to calculate and interpret each ratio. The exam will test your ability to apply these ratios to basic financial statements and to use them in straightforward investment analysis.
Level II: Application and Analysis
Level II takes your understanding of financial ratios to the next level. Here, you’ll encounter more complex scenarios that require you to analyze financial ratios in conjunction with other financial metrics. You’ll need to evaluate how changes in financial ratios can impact a company’s valuation and investment potential.
Level III: Synthesis and Strategy
By Level III, you’ll be expected to synthesize your knowledge of financial ratios and apply it to portfolio management and strategic decision-making. The focus shifts from calculation to application, as you’ll be required to use financial ratios to inform asset allocation, risk management, and investment strategy.
Final Thoughts: Mastering Financial Ratios for CFA Success
Mastering financial ratios is not just about passing the CFA exams—it’s about developing the analytical skills that are essential for a successful career in finance. These ratios are the bedrock of financial analysis, providing the insights needed to make informed decisions, manage risk, and drive value.
As you prepare for the CFA exams, focus on building a deep understanding of these ratios. Go beyond memorizing formulas—learn to think critically about what each ratio tells you and how it can be used in real-world financial scenarios. The more you practice, the more intuitive these concepts will become, and the more prepared you’ll be to tackle the challenges of the CFA program and your future career.
So, as you dive into your studies, remember that every ratio you master brings you one step closer to not just passing the exam but to unlocking the potential of your future in the world of finance. Keep pushing forward, stay motivated, and let these essential financial ratios be the keys to your success.