The Challenge of Making CFA Content Come Alive
Every CFA candidate knows the paradox of the exam journey… you absorb thousands of pages of material, memorize countless formulas, and train yourself to analyze markets and instruments you may never have seen firsthand. The CFA Program is rigorous for good reason – it builds the intellectual foundations of finance professionals. Yet it can also feel painfully theoretical, especially for those who have not worked directly in financial markets.
Textbooks and question banks prepare you for exam day, but they don’t always show you how the real world breathes life into concepts like volatility, yield spreads, currency exposure, or option pricing. This is precisely where digital tools can bridge the gap between pure theory and practical understanding.
One such tool is TradingView.
For those who have never heard of it, TradingView is a modern, web-based platform for charting, market analysis, and financial data visualization. Though widely used by traders and investors for live markets, it offers features that are profoundly useful to CFA candidates (across all levels) who wish to deepen their learning, sharpen intuition, and make abstract ideas tangible.
What Is TradingView?
At its core, TradingView is an online platform that displays price charts for financial assets from around the world. Users can analyze stocks, currencies, commodities, indices, cryptocurrencies, bonds, and more. It’s fully browser-based, accessible on mobile and desktop devices, and provides real-time market data and news.
However, TradingView is far more than a charting tool. It offers:
- An interactive community where users share analyses and discuss market ideas.
- A scripting language, Pine Script, to build custom indicators and backtest strategies.
- A vast library of indicators, overlays, and drawing tools for technical analysis.
- Access to fundamental data on listed equities.
- Customizable alerts for price levels, indicators, or specific conditions.
While traders use these features to make market decisions, CFA candidates can harness them to enhance their exam preparation, making theoretical knowledge vivid and applicable.
Making Technical Analysis More Than Lines on a Page
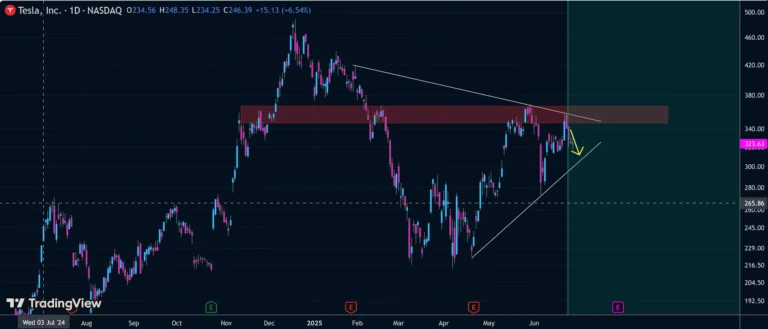
One of the first points where TradingView proves invaluable is in technical analysis. Although the CFAI curriculum is heavily weighted to fundamental analysis, technical analysis is a topic introduced in Level I and built upon in later levels. In textbooks, chart patterns like head-and-shoulders formations, double bottoms, or flags are shown in neatly drawn examples. Indicators like moving averages or relative strength indexes are described with textbook precision.
Yet, nothing replaces the power of seeing these patterns emerge in real price data. On TradingView, a CFA candidate can call up historical charts and explore how these patterns actually look in messy, real-world market conditions. Rather than memorizing static pictures, candidates can develop the skill of recognizing these signals amidst noise – an invaluable asset both for the exam and for future professional work.
Connecting Asset Classes to Reality
The CFA curriculum covers a broad spectrum of asset classes. Equities, bonds, commodities, currencies, derivatives, and alternative investments all receive attention across the three CFA exam levels. However, for many candidates (especially those not working in markets) these remain abstract concepts.
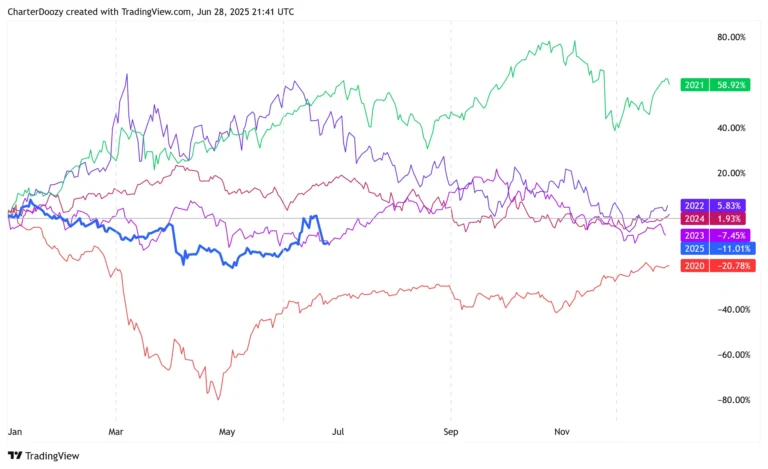
TradingView provides live data and historical charts for all major asset classes. A candidate studying commodity futures can examine crude oil price movements over years. Someone learning about currency exposure can observe how EUR/USD fluctuated during key geopolitical events. An equity candidate can see how market corrections unfolded in real time, reinforcing lessons about volatility and market risk.
By exploring these charts, CFA candidates begin to grasp not only the mechanics of different markets but also their unique personalities. This exposure helps transform rote learning into genuine market intuition.
Understanding Economic Indicators Through Live Markets
Economic data releases (GDP growth, inflation numbers, employment reports, etc) are critical topics throughout the CFA curriculum. Candidates learn how such releases affect markets and shape investment decisions. However, the curriculum alone rarely demonstrates how swiftly markets react to unexpected economic news.
TradingView integrates economic calendars directly into its charts. This means a candidate can view, for example, how the S&P 500 reacted to a surprising jobs report, or how bond yields shifted following an inflation release. Observing these cause-and-effect relationships is transformative. It deepens understanding of market efficiency, behavioral finance, and the practical implications of macroeconomic trends – all crucial for CFA candidates, particularly at Levels II and III.
Enhancing Equity Valuation Practice
Equity valuation is a pillar of the CFA Program. Whether candidates are tackling discounted cash flow models in Level II or portfolio management decisions in Level III, they must be comfortable with valuation metrics like price-to-earnings ratios, dividend yields, and book values.
TradingView provides fundamental data for many listed global equities, including P/E ratios, dividend yields, and revenue figures. While it doesn’t replace financial statements in full detail, it allows candidates to see how valuation metrics fluctuate over time and differ across sectors or geographies. This context helps candidates move beyond memorizing formulas to appreciating how valuation metrics connect to market expectations, risk sentiment, and industry dynamics.
For example, a candidate studying residual income models can examine real companies whose book values and earnings reveal why certain stocks trade at premiums or discounts. Seeing these dynamics play out in actual data bridges the gap between CFA readings and professional practice.
Reinforcing Portfolio Management and Correlations
Portfolio management dominates Level III but begins in Levels I and II. Concepts such as diversification, correlations, and asset allocation form the backbone of portfolio theory. However, they often remain theoretical until candidates see them visualized.
TradingView enables users to compare different assets side by side. Candidates can observe how equities and bonds behaved during market turmoil, or how commodities sometimes move inversely to stocks. Such observations breathe life into the notion of diversification. Instead of accepting on faith that low correlations reduce portfolio risk, candidates can witness this principle in real data.
Moreover, TradingView’s charting capabilities allow candidates to visualize how correlations can change during periods of stress – a crucial insight for advanced portfolio management topics.
Exploring Behavioral Finance in Real Time
Behavioral finance features increasingly in the CFA curriculum, especially at Level III. Textbooks outline biases such as overconfidence, herding, loss aversion, and anchoring. But these concepts remain abstract until candidates see them reflected in real investor behavior.
TradingView’s social features create a fascinating laboratory for behavioral finance. Users share public analyses and trade ideas, complete with commentary that often reveals sentiment shifts, overconfidence, or panic. Watching collective mood swings unfold (especially during major news events) offers candidates an authentic window into behavioral dynamics.
Understanding how emotions manifest in market commentary and price action can strengthen candidates’ grasp of behavioral biases and how these might influence portfolio decisions or investment policy statements.
Bringing Fixed Income Concepts to Life
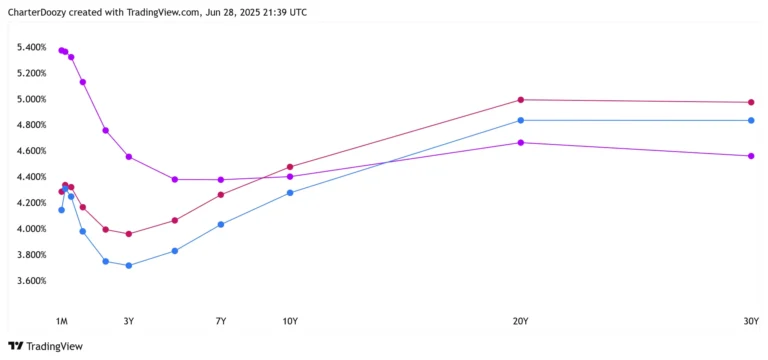
Fixed income analysis is both essential and notoriously dry for many CFA candidates. Yield curves, spread analysis, and interest rate movements are often taught through charts and tables, but candidates rarely experience how these instruments trade in real markets.
TradingView offers live and historical data for government bond yields across numerous countries. Candidates can examine how the U.S. yield curve flattened during monetary tightening or steepened amid economic recovery. This context clarifies why certain portfolio strategies, such as barbell or bullet strategies, might be employed in response to yield curve shifts.
For candidates preparing for Level III, seeing yield curve dynamics visually reinforces how macroeconomic changes influence fixed income markets – a perspective that can be invaluable when tackling constructed response questions involving portfolio decisions.
Practicing Trade Execution Without Risk
Understanding market mechanics and order types is part of the CFA Program, particularly for candidates who may one day work in trading or portfolio management. TradingView’s paper trading feature allows users to simulate trades using virtual funds. This offers CFA candidates a low-risk environment to practice placing orders, experimenting with stop losses, and observing how slippage can affect execution.
While not a direct CFA requirement, this practice fosters familiarity with market operations and bridges the gap between theoretical study and real-world application.
Caveats and Complementary Role
While TradingView is an extraordinary tool, it’s essential to emphasize its role as a supplement rather than a replacement for CFA study materials. It does not provide full financial statements in regulatory format, nor does it replicate the depth of institutional data services like Bloomberg or FactSet.
Moreover, TradingView cannot substitute for CFA Institute’s official curriculum, practice exams, or the unique rigor of CFA-style exam questions.
Its true power lies in making the material more tangible, engaging, and memorable.
Blending Tools and Theory
CFA candidates stand at a unique intersection of rigorous theory and the evolving tools of modern finance. Platforms like TradingView empower learners to see markets in action, test ideas, and bridge the intimidating chasm between textbooks and the real world.
Using TradingView, candidates can transform their study process from a purely academic exercise into an immersive journey through the living, breathing dynamics of global markets. It is this practical context, layered on top of rigorous study, that ultimately builds not just exam success, but the deeper intuition and confidence that define a true investment professional.
As the finance world grows increasingly data-driven and interactive, CFA candidates who blend traditional study with practical tools like TradingView will be better equipped to thrive in the dynamic world that awaits them beyond the testing center.